MONTH’S HIGHLIGHTS
- The Monetary Policy Committee (MPC) met on 29th May 2023 and decided to maintain the Central Bank Rate (CBR) at 9.50%, noting that the impact of the previous monetary policy tightening in March 2023 to anchor inflationary expectations was still being transmitted in the economy. The MPC also noted that the government’s measures, including duty-free imports of specific food items like sugar, will help moderate prices and alleviate domestic inflationary pressure.
- Inflation saw a slight increase to 8.03% in May from 7.91% in April. The rise was notably impacted by higher food prices, with food and non-alcoholic beverages inflation rising by 1.4% to 10.2%. The surge in food prices was ascribed to the rising cost of sugar, as duty-free imports failed to lower retail prices. The housing, water, electricity, gas and other fuels index rose 0.7%, owing to increased kerosene prices. The prices of gas/LPG, however, declined by 0.3%. The transport index also went up 1.2% as a result of hiked fuel prices.
- The National Treasury gazetted the actual revenues and expenditures for the 10 months of the financial year 2022/23 ending 30th April 2023. Total revenue collected during the month amounted to Kshs 1.64 trillion, accounting for 76.64% of the original Kshs 2.14 trillion estimates. However, this falls short of the prorated amount of Kshs 1.78 trillion expected for the first 10 months. Total expenditure amounted to Kshs 2.32 trillion, representing 65.37% of the original estimates. The deficit was plugged by a total of Kshs 686.59 billion in financing.
- China’s funding for the 2023/2024 fiscal year is expected to decline significantly by 94.10% to Kshs 1.74 billion, reflecting caution in lending due to loan defaulters and borrowing capacity restrictions. In contrast, the World Bank provides a substantial loan of Kshs 136.5 billion to address liquidity challenges and enhance foreign exchange reserves. Additionally, the International Monetary Fund (IMF) supports Kenya’s economic reforms and climate resilience efforts with additional funding. This includes USD 544.3 million under the existing Extended Credit Facility (ECF) and Extended Fund Facility (EFF) arrangements, USD 544.3 million under the new Resilience and Sustainability Trust (RSF) arrangement and another USD 410 million, bringing the total IMF financial support to USD 3.52 billion.
- The Economic Survey 2023 highlighted Kenya’s economic performance, with a 4.8% expansion in real GDP in 2022. While all sectors contributed to growth, service-oriented activities stood out. The agriculture sector contracted by 1.6% due to drought conditions. Key sectors supporting growth included finance, insurance, information & communication and transportation. Despite a slowdown, agriculture remained the dominant sector, comprising 21.2% of GDP. Private and government consumption expenditures increased, driving overall economic activity. Gross National Income and Gross National Disposable Income also saw significant growth. The survey also emphasizes the importance of sustaining diverse sectoral performance for long-term economic stability.
- Moody’s downgraded Kenya’s long-term foreign-currency and local-currency issuer ratings to B3, citing increased liquidity risks and worsened domestic funding conditions. Weaker demand for government securities, specifically long-term bonds, has impacted the government’s fiscal accounts, leading to payment delays and the accumulation of arrears. The government’s ability to raise funds domestically is crucial for meeting its financing needs.
- The Eurozone inflation rate dropped to 6.1% in May 2023, reaching its lowest level since February 2022. This decrease was driven by lower energy prices and a slowdown in cost pressures for various sectors. However, inflation remains significantly higher than the European Central Bank’s target of 2.0%. The core inflation rate, which excludes energy, food, alcohol and tobacco, also eased more than expected, reaching 5.3%.
ECONOMIC INDICATORS
Foreign Exchange Reserves
During the month, the usable foreign reserves decreased by 0.45% to settle at USD 6.48 billion (3.60 months of import cover). This lies below CBK’s statutory requirement to endeavour to maintain at least 4 months of import cover as well as EAC region’s convergence criteria of 4.5 months of import cover.
Currency
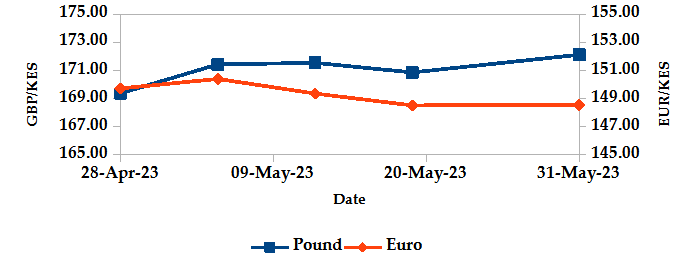
The Kenyan Shilling depreciated against the USD and the Sterling Pound by 1.90% and 1.63%, exchanging at Kshs 138.49 and Kshs 172.12 at the end of the month, up from Kshs 135.91 and Kshs 169.37 respectively in the previous month. The Shilling strengthened against the Euro by 0.79%, exchanging at Kshs 148.54 at the end of the month, down from Kshs 149.72 in the previous month. The depreciation against the Dollar is a result of rising demand from importers and investors mitigating their risk by holding foreign currency deposits.
USD Vs KSHS

STERLING POUND & EURO Vs KSHS
Inflation
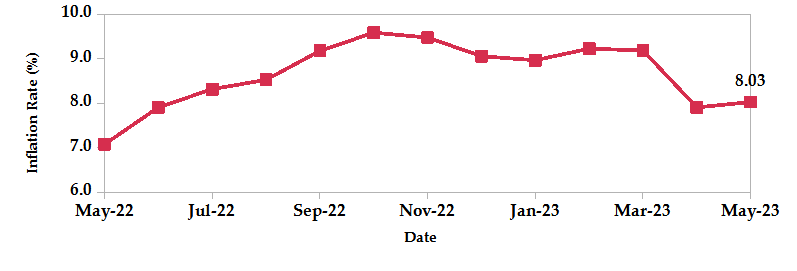
The overall year-on-year inflation slightly increased to 8.03% in May from 7.91% in April. This is mainly attributed to higher food and fuel prices.
INFLATION EVOLUTION
Liquidity
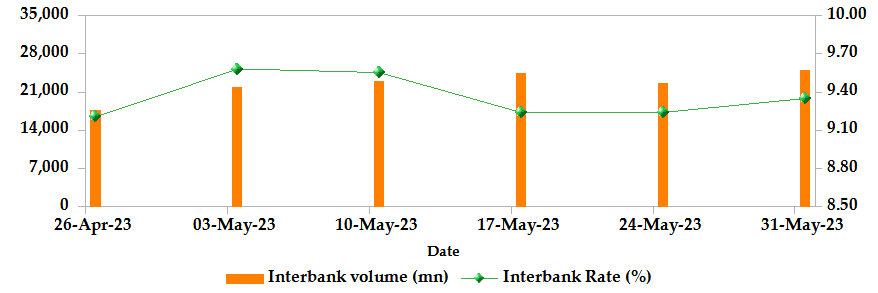
During the month, liquidity increased as a result of government payments which more than offset tax remittances. The interbank rate declined to 9.35% from 9.37%. The volume of inter-bank transactions increased to Kshs 25.07 billion from Kshs 12.87 billion. Commercial banks excess reserves increased from Kshs 22.10 billion to Kshs 26.10 billion.
INTER-BANK RATE and VOLUME
FIXED INCOME
T-Bills
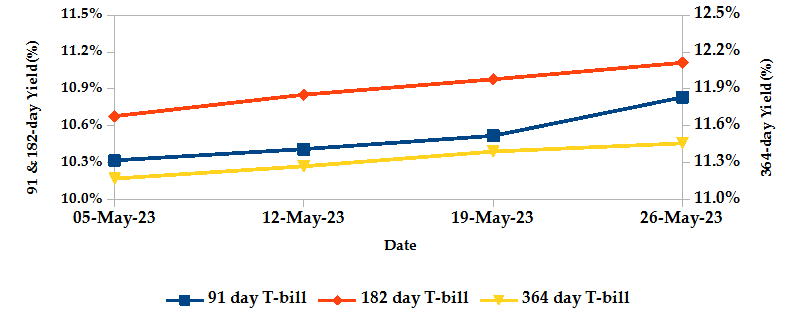
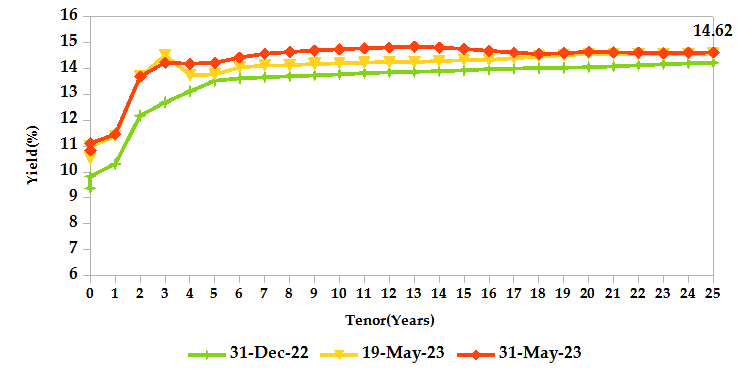
T-bills recorded an overall subscription rate of 135.40% during the month of May, compared to 110.33% recorded in the previous month. The rise in subscriptions was propelled by investors gravitating towards T-bills, particularly the 91-day paper, as they sought to capitalize on their attractive yields. The performance of the 91-day, 182-day and 364-day papers stood at 583.04%, 56.10% and 35.64% respectively. On a monthly basis, yields on the 91-day, 182-day and 364-day papers increased by 5.42%, 5.73% and 2.99% to 10.83%, 11.11% and 11.46% respectively as investors aggressively bid to compensate for a weaker Shilling and inflationary pressures.
T-BILLS
T-Bonds
During the month, T-Bonds registered a total turnover of Kshs 64.00 billion from 1,706 bond deals. This represents a monthly increase of 65.43% and a decline of 1.22% respectively. The yields on government securities in the secondary market increased during the month of May.
In the primary market, CBK reopened the 3-year fixed coupon treasury bond; FXD1/2023/003 twice seeking 10.0 billion and 20.0 billion. Additionally, Central Bank issued a new 7-year infrastructure bond; IFB1/2023/007 targeting 60.0 billion with the period of sale running from 26/05/2023 to 13/06/2023 and a market-determined coupon rate.
In the international market, yields on Kenya’s Eurobonds decreased by an average of 207 basis points.
YIELD CURVE
EQUITIES
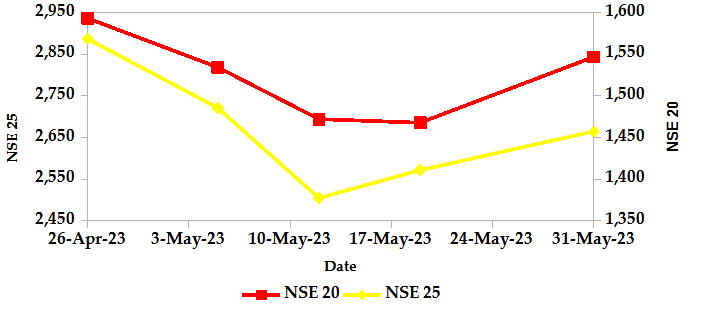
During the month, market capitalization lost 3.67% to settle at Kshs 1.61 trillion. Total shares traded increased by 54.79% to 306.59 million shares while equity turnover rose 27.02% to close at Kshs 5.35 billion. On a monthly basis, NASI, NSE 20 and NSE 25 settled 3.66%, 2.03% and 6.66% lower. The performance was a result of losses recorded by large-cap stocks such as Equity, Stanbic and Co-operative of 17.25%, 11.21% and 9.02%.
NSE 20 and NSE 25
ALTERNATIVE INVESTMENTS
- The derivatives market, over the month, recorded 54 contracts with a turnover of Kshs 4.08 million which was an increase from 22 contracts with a turnover of Kshs 1.30 million recorded in the previous month.
- I-REIT market, over the month, recorded a turnover of Kshs 0.93 million with 139 deals which was a decrease from Kshs 3.47 million with 220 deals recorded in the previous month.
- The ETF market, over the month, recorded a turnover of Kshs 1.01 million with 1 deal which was a decrease from Kshs 1.52 million with 2 deals recorded in the previous month.
GLOBAL AND REGIONAL MARKETS
| Global Markets | Weekly Change | Monthly Change |
|---|---|---|
| S&P 500 | 0.25% | 9.30% |
| STOXX Europe 600 | -3.19% | 4.05% |
| Shanghai Composite (SSEC) | -3.57% | 2.83% |
| MSCI Emerging Market Index | -1.90% | -0.42% |
| MSCI World | -1.25% | 7.68% |
| Regional Markets | Weekly Change | Monthly Change |
|---|---|---|
| FTSE ASEA Pan African Index | 3.15% | 2.78% |
| JSE All Share | -3.56% | 2.39% |
| NSE All Share (NGSE) | 6.42% | 8.09% |
| DSEI (Tanzania) | -2.42% | -3.56% |
| ALSIUG (Uganda) | -8.27% | -15.73% |
- Global markets experienced a predominantly negative performance during the month. In the US, the S&P 500 edged 0.25% higher while the Dow Jones index declined by 3.48% compared to the previous month. In Europe, both the STOXX Europe 600 and the UK’s FTSE 100 indices were down by 3.19% and 5.39% respectively. In Asia Pacific, the Shanghai Composite (SSEC) index dropped by 3.57%. This was attributed to the unexpected rebound in US job openings which raised concerns among investors about potential interest rate hikes by the Federal Reserve. Furthermore, worries about a potential global economic slowdown emerged due to weak factory activity in China.
- On a regional front, markets posted mixed performance. The FTSE ASEA Pan African index, representing the overall African markets gained 3.15% from April. South Africa’s JSE All Share, Tanzania’s DSEI and Uganda’s All Share index lost 3.56%, 2.42% and 8.27% respectively, while Nigeria’s All Share Index gained 6.42%.
- On the global commodities markets, oil future indices declined due to concerns about a slowdown in demand, particularly from China, the leading importer of crude oil. Crude Oil WTI futures and ICE Brent Crude Oil settled 11.32% and 8.65% lower to close at $68.09 and $72.66 respectively.
Get future reports
Please provide your details below to get future reports: